Rayner Teo - This SIMPLE Trading Strategy Has A 88.89% Winning Rate
https://youtu.be/W8ENIXvcGlQ
The first rated hit that came up for me when I searched "best trading strategy" on Dec. 29th 2021 was "Rayner Teo" with "This SIMPLE Trading Strategy Has A 88.89% Winning Rate".
The nice thing about this video is that he gives very clear rules for entry and exit signals. However, this seems to be a strategy specific to the S&P 500. Nevertheless we will attempt to run it for crypto.
If you find the information provided here useful, please consider signing up for the HaasOnline Bot or the FTX Exchange via my referral link. 🤗
You can also directly send me a donation (₿) bc1q7vl36e44e06zmedqrxdzauqea9k7rgcfmylsq4
strategy rules as presented in the video
market conditions:
comments
This strategy has another layer to it which is market open and closing times. He talks about entering during market open with a market-order. Similarly if the 10-trading days threshold is reached the exit-trigger would be to sell at the (day 11) market-open.
As crypto-trading doesn't observer any trading hours, we will have to exclude this layer.
please comment if you have a suggestion how to observe this layer to the strategy within crypto-trading
building the strategy
After creating and naming our script in the Visual Editor, we go to the left and need to change a few settings, depending on your Account and Market setup this may look different.
First, we need to set the Main Interval to the 1 day timeframe in the Settings, to satisfy the 200-day requirement of the market conditions segment.

Then we pick the ClosePrices and SMA (Simple Moving Average) from the Commads tab on the left side and add them to the workspace.

We need to connect the dots and because we want to set the lookback period of the SMA to 200 days we need to tell the bot what range it should consider for the SMA. We have two options here, either we right-click on period on the SMA block and change it to a field and enter 200, or we connect it to an Input block.

I will opt for an Input block here so we can modify it easier during backtesting in Haas Labs later.
I'm also adding a Plot block to it so we can see it when we test out if we did everything correctly.

Now we can give it a quick spin and see if we connected all the dots properly.
On the top side of the script editor you have your usual functions like new, save-as etc., but for this little mini-test we click Save and open up the Compile Log (blue), the Chart (green) and then press the Quick Backtest (red) button to see if we can successfully plot a line on the chart. The bot might need to load a bit of price history first.

And boom, just like magic we made our first squiggly line plot on our little bot.
The Compile Log is nice to have open on the side, for debugging purposes and for finding issues that aren't easily visible on the chart.

Next, we need to add the actual trading signals and logic to the bot, so it can perform trades.
According to the strategy outline, we want to enter a trade if the 10-period RSI is below the 30 level buying on the "next day's open".
Because the crypto-markets are open 24/7 and for simplification purposes we will have to reduce the entry-trigger to a simple RSI < 30.
We pick our blocks we need from the Commands tab and add them to the workspace.
I'm opting for Input blocks once again here to be able to do some Haas Labs backtesting later and easily change the parameters.
In the image below I connected the RSI to the ClosePrices block we already added, but you could add a new block to keep the script clean. Larger scripts made with Visual can get quite messy, so making an effort to visually distinguish can be worth the time if the script gets more complex.
We also add another Plot block to our script to display the RSI on the chart.
Notice how on the SMA-plot the chartId is set to 0 and on the RSI-plot the chart is set to 2. Line-plotting on chartId 0 puts the lines on the candlestick price bars, values of 2 and above put the plot below the price chart. Values of -2 and below put any Plot-outputs above the the chart.

We also add a IsSmallerThan block to the logic, because we want the bot to buy or open a long-position if the price is below the RSI-30 level. In our case we compare the RSI output value with a fixed value of 30.
You can mouse-over the (i) on the top-right corner of any block to see further information about the block and its dots.
For the IsSmallerThan block for example we learn that the block checks "If input1 is smaller than input2." and thus we know how to connect the dots.
Our first part of the logic is done (comparing the RSI with the Input-value of 30). Triggering an "is true" output at the orange dot of the IsSmallerThan block if the RSI is smaller than 30.
Next we need to consider the other part of the entry-trigger, which is the market condition of the price ranging above the 200-SMA level.
One consideration here for improving the bot in the futre might be if it is enough to have the price above the 200-SMA level and stay above for a certain amount of time, or if it is sufficient for the price to be closing above this level once. For simplicity we will use the later trigger in this example.
To do that we add a IsBiggerThan block to compare the price vs the SMA and connect it with the SMA output and the market-price.
One thing to know about some blocks in HaasOnline Visual is that they output an array or a set of values, not just a single number. So for example the ClosePrices block actually looks up the most recent close prices, not just one.
To be able to compare just the most recent price vs the 200-SMA we need to querry only the most recent Closing Price of the data-set and send that to the IsBiggerThan block.
In this example we will add the ArrayIndex block, connect it to the ClosePrices block and right-click the ArrayIndex block where it says "index" and change that to a "field" and enter the value 1.
In this way the bot only compares the last value of the ClosePrices array with the SMA-200.
We also need to add an "And" block, to make sure that both conditions are true (RSI<30 and last Close Price < 200 SMA), before we allow the trigger signal to be sent.

With our entry-trigger complete we need to add the action that should happen if the trigger turns true. In out example we want to open a long position.
In more complex scripts it is advisable to work with more carefully managed ways to enter a position, especially to avoid any taker-fee's that are due if you simply fire a market-order, like in this case.
If you find the information provided here useful, please consider signing up for the HaasOnline Bot or the FTX Exchange via my referral link. 🤗
You can also directly send me a donation (₿) bc1q7vl36e44e06zmedqrxdzauqea9k7rgcfmylsq4
For this example and for simplicity sake we will however chose to simply enter a long-position via a market-order, as this is the simplest way of actually making the bot enter a position without having to define a whole subset of further parameters, like entry price, order type, order timeouts and many more.
Over time I will try and add more in-depth tutorials how to add managed orders that work with maker or MakerOrCancel-order type of entries. A link could be here.

The problem with this setup above however is that we should probably make sure that we are not firing the trigger to frequently and create multiple entries, which is one of the more tricky parts in HaasOnline Visual. Order management and order execution, as they can get quite complex fast.
So in our example we check if we have an open position and if not, we allow the order to execute. There are a few ways to do it, but for this example we will use a block called GetPositionDirection and check if it is equal to NoPosition.
We simply add that to the list of required "is true" outputs for our And-trigger and then we are almost ready to test-drive our bot for the first time.

We also add a simple PlotHorizontalLine to the bottom part of our chart to be able to see the 30-value of the RSI more easily. Remember that we chose 2 for chartId, because that is where we plot our RSI and we want the line to be visible on that part of the chart. Right-clicking dots allows to change it to fields to enter values if you don't want to add an Input block.
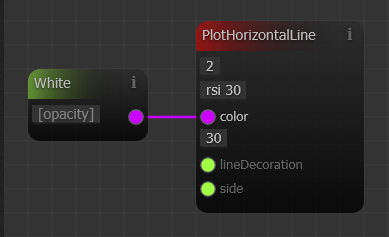
Hard-coding the 30 value here is an option, but the smarter way is probably to directly connect it to the RSI IsSmallerThan Input block so it changes automatically if we adjust this input, both in the check and the plot.

At this point in time we are ready to Save and give our bot our first test-drive to double check if our entry trigger setup worked. To do that we click on the Quick Backtest button above or you can define a longer timeframe by opening the Backtest Script (Backtest Remote) and customize your timeframe.

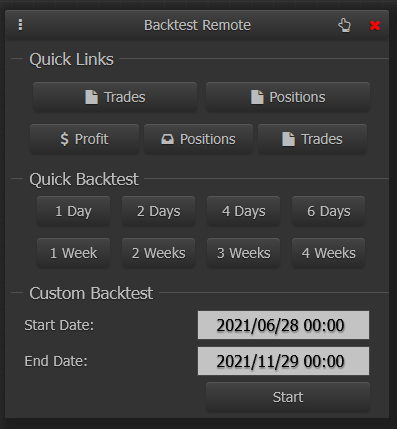
Remember that at this point in time, we do not have a defined exit-trigger, so the bot doesn't even know that exiting a position is possible. But often times entry-triggers are the first step of a script, where as actual position entries and exits often come with a copy-pasta setup of blocks you have from a different script.
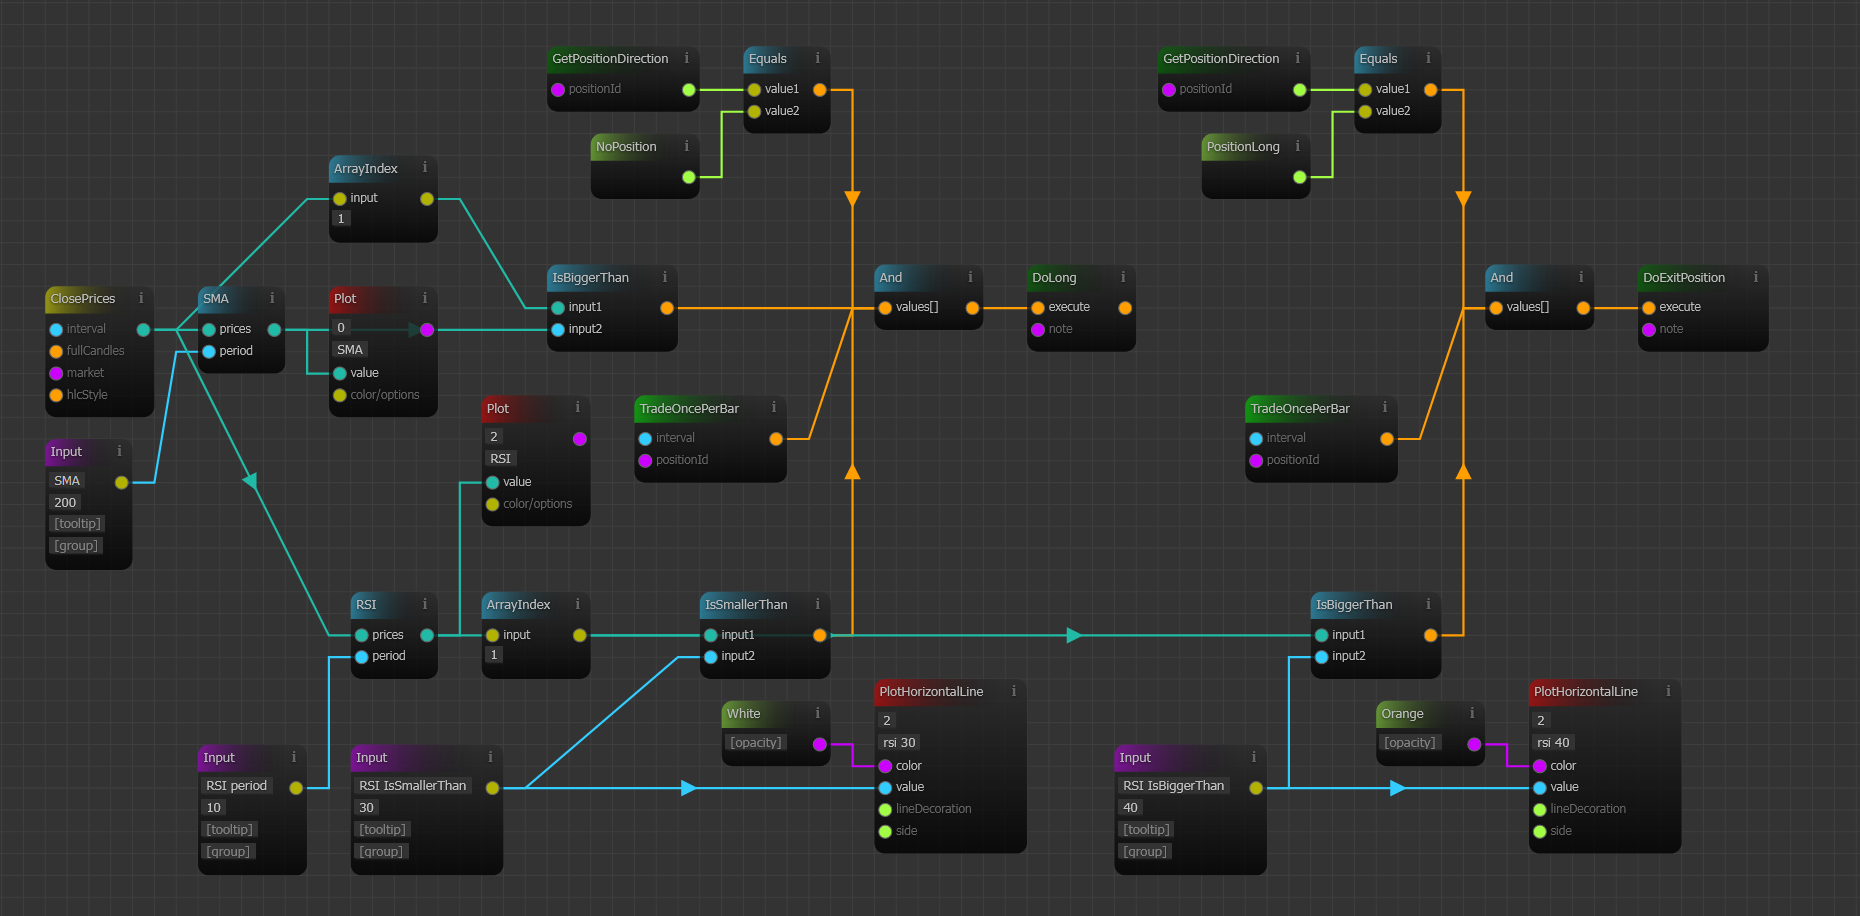
Right now the script should look like this

When I tested it on the 29th of Dec. 2021, it actually produced one single signal! 🤣
Success? 🤔 Maybe.
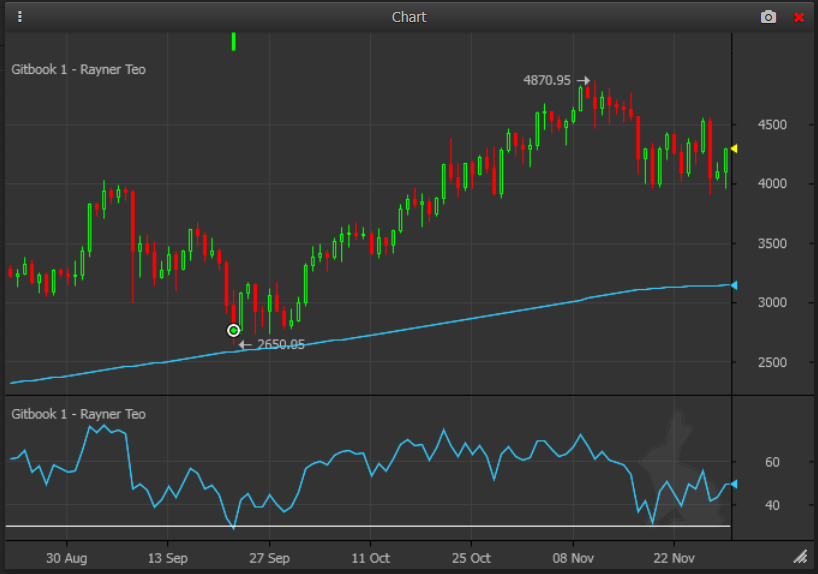
The test was on the ETH-PERP market on Kraken at the time of writing for a timeframe of 3-months.
You can see where the bot took the position (green circle) based on the signal (where the bottom blue RSI line is below the white 30-value line from our Input block.
Looking at the Compile Log gives us more information, including Shape Ratio, Win%, ROI etc.
Note that we have not closed the position, so the stats are not calculated properly.
The bot doesn't know how to close a position yet, so we have to figure that out next.
The bot also blocked one other entry on the 22nd of Sept., because we already had an open position in this backtest.
This is turning out to be nice example. In many other testing scenarios you might get opens and closes of positions all over the place, which can require some deep dive-digging into the Compile Log to understand what is going on.

Alright, with the entry-trigger out of the way lets set up our exit-trigger. According to the video we exit the trade if the RSI goes above the 40 level or if the trade has been open for 10 days.
We know how to check for the RSI level already, as it is similar to what we have on the entry-trigger. We also remember to double check that we only close a position if we have an open long-position.


One issue I noticed during the testing was that if we leave it as is and just slap a DoExitPosition at the end of this, closing a position will trigger frequently, if we don't make sure to close the position only once. The black splatter you see on the image is the bot open and closing positions like mad. Oops! 😂

I also noticed during this test that we had been comparing the whole array, which includes a mutlitude of values from the RSI and not just the last value of the RSI, like we have been doing with the ClosePrices previously. So we have to add this in before comparing it.

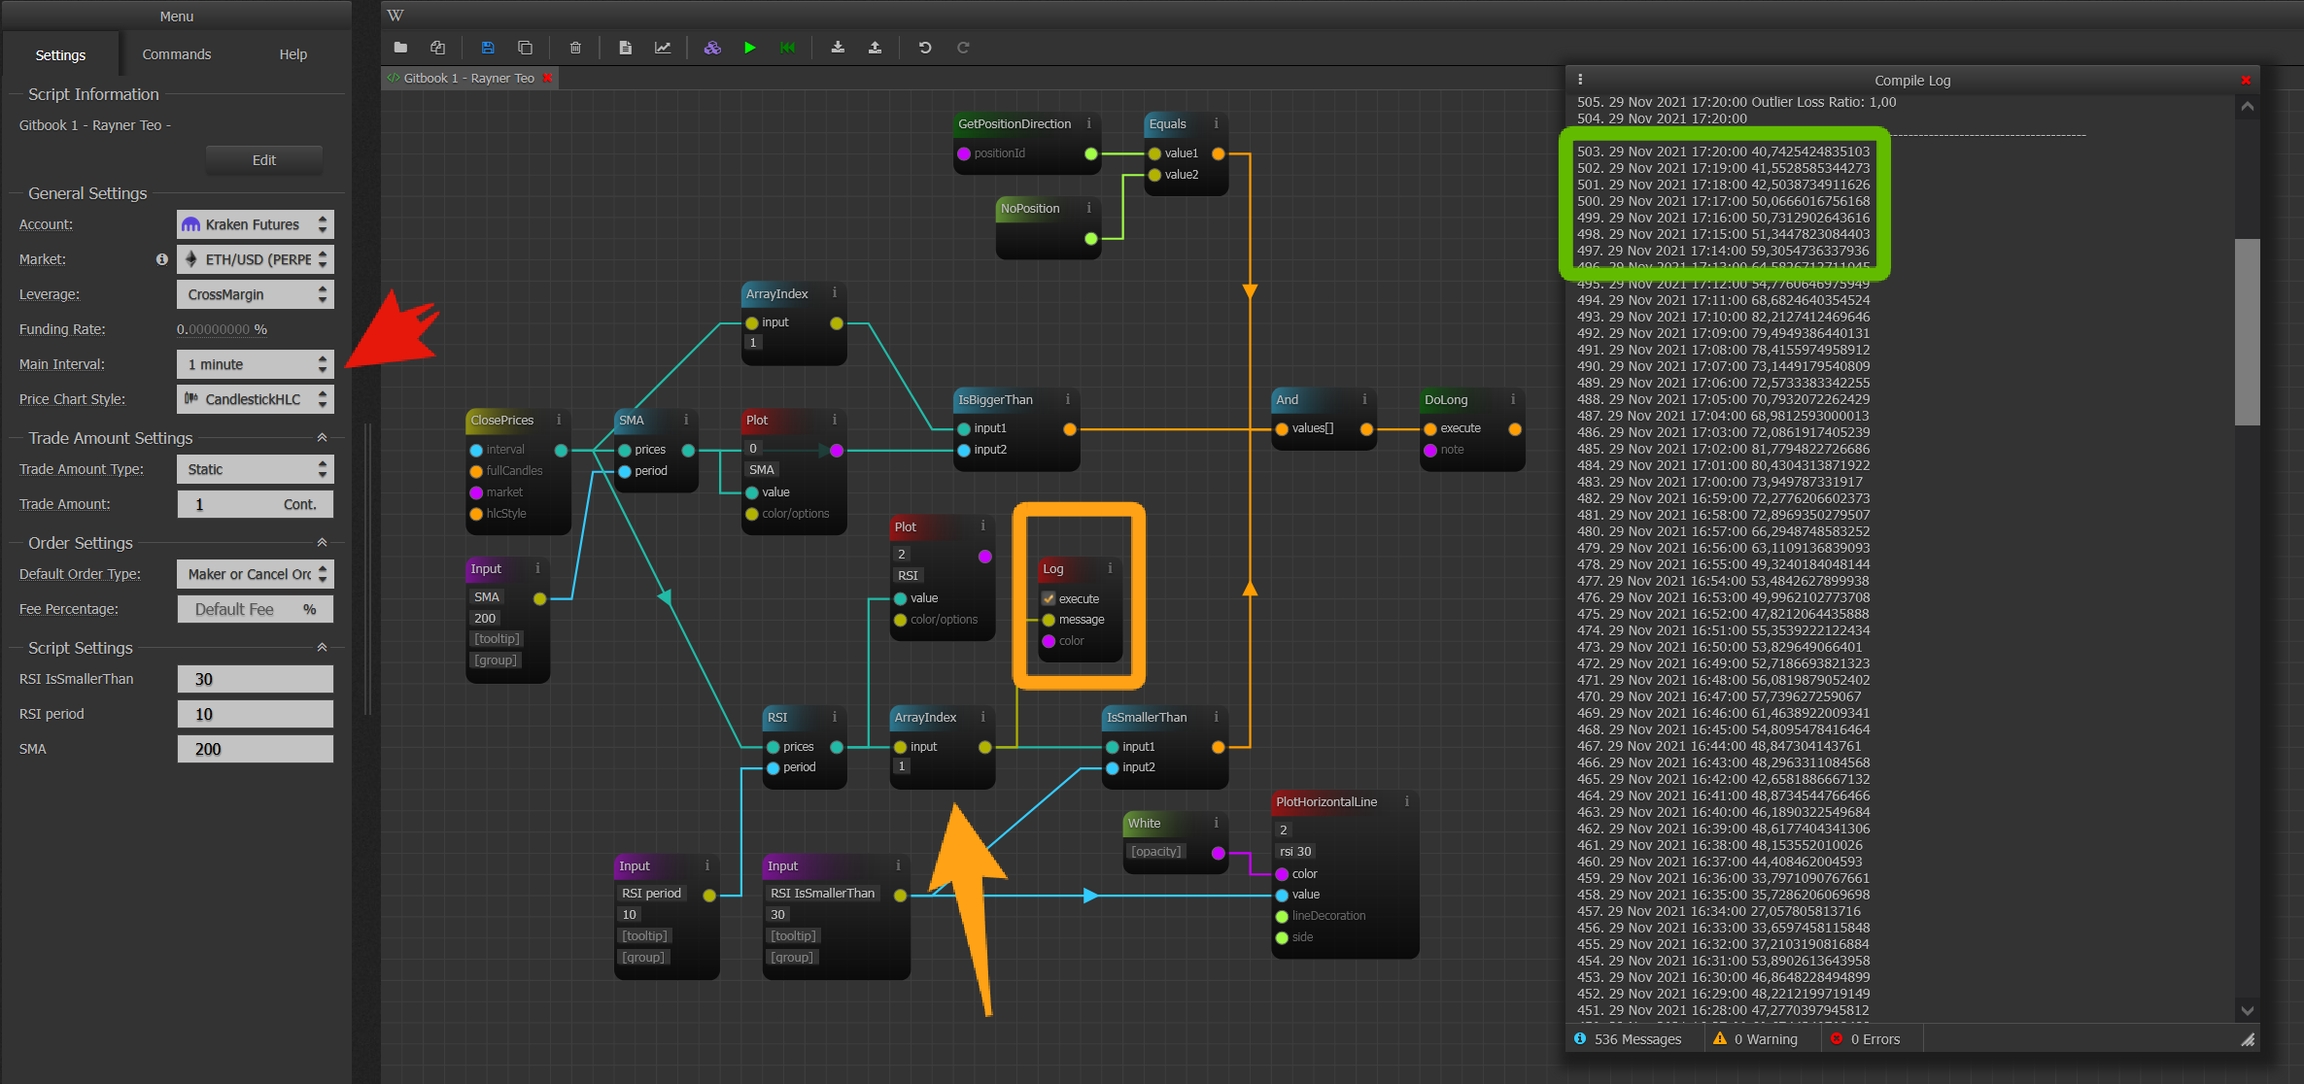
This little mishap however, is a good introduction to debugging and finding issues. One very useful tool for that is the Log or logging block we can attach to figure out whats going on via the Compile Log. Let's do that and look at the output.

To log a value, it needs to have a trigger when to log it. This is useful in many situations, but sometimes you just want it to fire all the time and log everything. So we need to set it up to do that: right-click on the orange execute dot to, click on "Change to checkbox" and then tick the box.

Now if we attach that to the RSI output we notice quite a lot of numbers as the output. Whoops, a bit too much. We have to fix that by only looking at the last output of the RSI in a similar way we did to the ClosingPrices.

After adding the ArrayIndex block to the RSI filtering the output, we have much more useable values. Notice that in the screenshot below I temporarily changed the Main Interval to 1 Minute to be able to get a faster testing-response from the bot who loads faster on the smaller time-interval. Thats why we get one number per minute.
Swapping between intervals is sometimes useful to double-check if your triggers work properly as designed. Especially testing triggers, just to see if you got the logic right.
Below you see how we added the ArrayIndex block and now Log the output of that.
Another way to prevent the bot from triggering too much is by limiting the amount of trades the bot can take per price-bar. One command to do that is TradeOncePerBar, which we can add to our And entry-trigger setup.

So after fixing our little bug 🐛 and adding our exit-trigger in a similar way with the blocks we utilized above we have a fully functioning bot, that opens a market-order long position based on an entry-trigger and market-order closes this position based on a different exit-trigger.
However, we are still missing the second part to our exit-trigger, which is the 10-period time of not exiting the position and we absolutely need to check our chart to see if there is any funky behaviour of our script.
Let's just testrun this script first and look if the entries work out as designed and check if we find anything that is technically correct, but maybe not expected behavior.
For testing-purposes to generate more signals I reduced the Main Interval to 1 minute, so we can generate more signals. We can always change that back later.
Scrolling through the entries (green dot) and exits (yellow dot) looks promising on the Chart in many cases, like these entries and exits for example (remember we don't have the 10-period exit-trigger implemented yet and we are using the 1-minute chart for testing).

However, upon scrolling further back we also notice potential issues as these two positions below are clearly a losing trade for example. Not only is the first order execution late (signal on the top aligns with the RSI crossing the 40 mark however), but in both cases during a short-term down-trend the signal given might not be ideal.

Backtesting the script as-is on the daily timeframe ETH-PERP chart produces one positive trade, which however could potentially be improved if we chose a different exit-trigger to ride the long uptrend ETH had.

Testing the script on the BTC-PERP daily chart did not produce any results however, neither did it on the LTC-PERP. So having an additional exit-trigger to close out the trade if the position is open for longer than 10-periods would not have mattered in the daily timeframe test we did here.


The second condition to the exit-trigger however, becomes relevant if we reduce the timeframe.
At the time of writing, I was not able to figure out how to add a time based trigger yet, so I went ahead and finished the article up including the frist testing part. Then I went to the official HaasOnline Discord Channel and posted my question. Luckily the nice guy Alex Tan helped us out with a sollution, which however turned out to be quite a complex add to the script. Turns out we already have a version 2 of this first script to look at as a bonus at the end of the article.
test results
So we can conclude the initial strategy writeup with a few simple observations:
the bot does make trades the way we set it up, but these trades are very infrequent on the daily timeframe ; but we learned how to set up a bot, which is a win ✨
somehow extrapolating a 88.89% winrate from the daily timeframe is not possible, because we can't backtest years of data like you can with the stock market, meaning our sample-size is too small
we will have to experiment with lower timeframes to see wether or not the general approach of buying below a 10-period 30-level RSI can make sense, however with knowing that some of the indicators may give worse quality signals on lower timeframes compared to longer-term market trends ; this is what the next part is about
with help from the community we can add our second exit-trigger and finetune the bot more, possibly adding further improvements
Overfitting
Haasonline has a feature called Haas Labs in which we can try various parameters and queue up multiple backtests at once! I will not go into the details of Haas Labs here, but it is a very nice way to quickly cross-check if other parameters for our Input blocks can lead to better or worse backtesting results.
Remember how we made a thing to pick Input blocks over hard-coding the values?
Haas Labs lets you input a range of parameters from your Input blocks (blue) to queue up multiple backtests in one go.
I am also selecting mutiple candle time-frames to fish for results during the test.
The bot will sample and tune various combinations based on the Tuning Settings you chose. It is also possible to brute-force the 16.464 combinations, but that takes too long and you get a pretty good idea with the Intelligent tuning type. Let's press Start Test, grab a tea and come back a few minutes later. ☕
If you find the information provided here useful, please consider signing up for the HaasOnline Bot or the FTX Exchange via my referral link. 🤗
You can also directly send me a donation (₿) bc1q7vl36e44e06zmedqrxdzauqea9k7rgcfmylsq4

high-timeframe results
The backtest results seem promising on high time-frames tested. However notice the very low total amount of trades and positions. In an 8-week testing period the bot traded as little as once.
date of testing: 29. Nov. 2021
🚩 This is a potential red-flag for some if you are looking for a high volume scalping strategy instead for example. You might just get a few trades out of this bot per year, which is argueably too low.
let me know if and under what circumstances you would run this bot, is this kind of result enough, or do we need more data?


testing the low-timeframe
However, maybe it makes sense to reduce the timeframe to get more data? It is questionable if its fair to compare a 200-sma daily chart trend with a 200-sma 5 minute chart trend.
Probably not, but lets fire up the bot and look at the results.
Mind you, that we are missing the seperate exit-trigger (close if RSI is not above 40 after 10 bars), which would fire more frequently as we have more signals overall.
The lower timeframe backtests produce some positive results, but all of them seem much worse than the high timeframe tests. Filtering negative ROI first also is a good reminder that a bot can really screw you up if you configure it wrong and have no way to turn it off or include some sort of shut-down mechanism.


live testing journal
info on if and which bot i am testing live
links and more
link to script on haasscripts
more testing done
links to improved versions of this script
completing the strategy with community help
After realizing initially I didn't know how to create a timestamp trigger, I reached out on the official Discord for help and the good guy Alex Tan quickly threw something together that will help us out to be able to finish up the strategy as described in the video!
Thanks again for the super quick help! I won't go into detail as to how this next set of blocks is built, because to be honest I am not 100% confident I understand all of it yet. But I heard that is how coding works anyway, you google stuff and copy pasta it - so that's what we'll do in this instance as well.

So for the actual copy-pasta of blocks we get a set that is almost as large as our whole script so far. That said, if we look at the details we basically save the timestamp once we open a long-position and then check for wether or not the current timestamp is greater than that. In the example code below you see that this feeds into a Or block, so we trigger the DoExitPosition if we have the RSI above 40 or if our timestamp is bigger than whatever we set as a time.
The tricky part is that we have to work with unix time and seconds, so we have to deal with hard-coded values of "added seconds". This also means it is not so easy to quickly throw it into Haas Labs like we did above. In the screenshot the AdjustTimestamp blocks are also connected to addYears instead of addDays, but we can fix that.

So first we add the Or block to our exit-trigger and then we fix the addYears into the addDays values and it should look something like this:


The whole script is now turning into a thing that doesn't fit on one screen any more. Remember when I said complex scripts in Visual can get messy? Well here we are. Anyway, lets get to testing this. I will add the whole script at the end so you can copy & import it for further testing.
backtesting the completed strategy
As mentioned earlier, running the bot on a daily timefram gave us one single entry in the ETH chart and no entries on the BTC and LTC charts. Maybe certain bots are already frontrunning one of the most "popular" YouTuber strategies and thus this market-condition in crypto isn't happening anymore?
Anyway, lets try out some lower timeframe backtests and see where get with it. Remember that for this Haas Labs session we are limited to the hard-coded timeframes of the exit-trigger. So if we code in the added timestamp as "add 864.000 seconds", then we are limited to testing the various parameters of the RSI or SMA on a daily chart. If we want to change that to a 12-hour or 4-hour chart, we have to update the hardcoded values of the script first.
12-hour chart
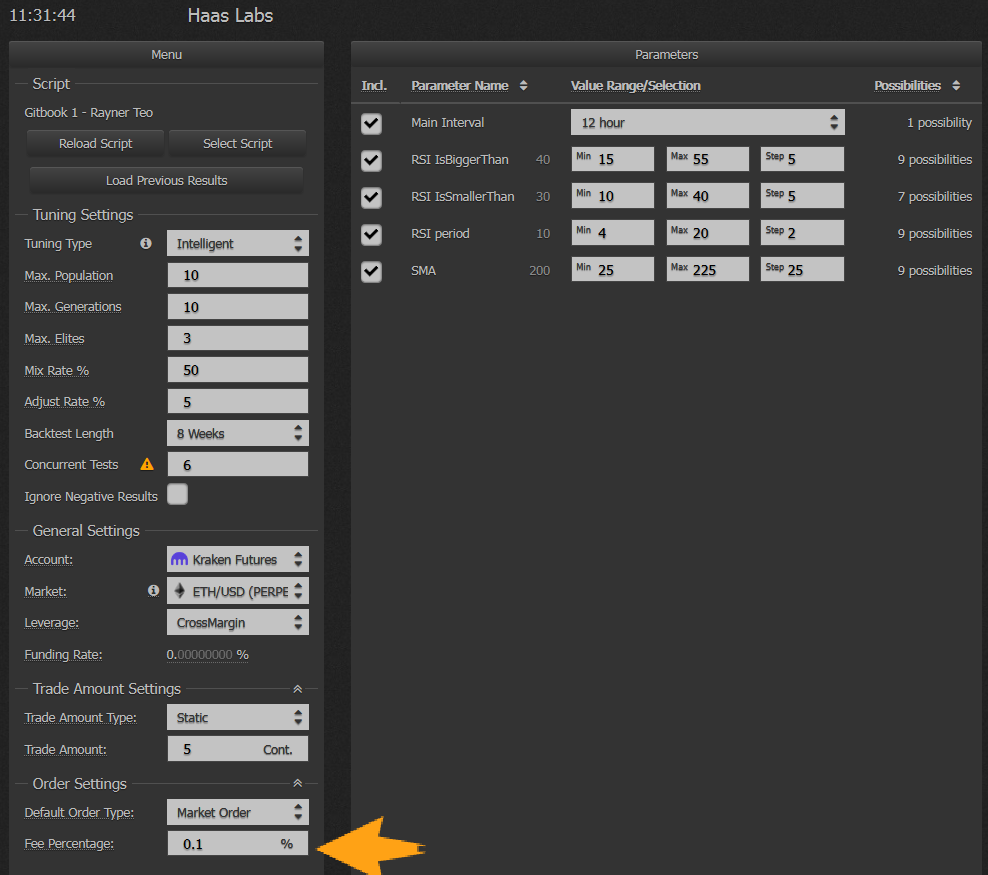
Our first round of tests will be on the 12-hour chart, with flexible parameters for the RSI<X buying trigger as well as a flexible RSI-period length. We can also throw in a flexible RSI>X parameter for our selling trigger. But we will always get stopped out by a hard-limit of 5 days (10 periods on a 12h chart).
We also have to consider the taker-fees, which are quite substantial in our bot, because we run market-orders with this bot.
The default taker-fees (market-order) with no VIP status levels for Coinbase Pro are 0.5%, 0.26% on Kraken, 0.1% on Binance and 0.07% on FTX. (last updated Nov. 2021)
For testing purposes we will assume a taker-fee of 0.1%, but be aware - taker-fees can ruin your profits fast!
A very reasonable improvement for this bot would be working with buy and sell-orders instead of market-orders, to get the maker-side fee structure. And honestly with how infrequently we are trading with this bot this is the #1 improvement we should make to it first.
But enough about how you are get ripped-off by the evil exchanges, lets fire up the backtesting, with various parameters for the RSI period, the RSI levels for buy & sell and a different SMA length. With the max-length of 8 weeks. This is honestly quite low and captures a very particular time in the crypto market.
If you find the information provided here useful, please consider signing up for the HaasOnline Bot or the FTX Exchange via my referral link. 🤗
You can also directly send me a donation (₿) bc1q7vl36e44e06zmedqrxdzauqea9k7rgcfmylsq4

Not quite an eternity, but after about 10 minutes we get the following backtest results. Low overall trade frequency, with the top results only trading 7x or 4x over the whole 2-month timeframe on the ETH-PERP market on Kraken. Interestingly enough the very low (4,6) RSI-period compared to the initial RSI-period of 10 is sending the profitable (?) triggers.
The #3 winnes of this 8-week, 12-hour, ETH-PERP (Nov. 30th - 2021) test are:
RSI IsBiggerThan: 45, 45, 50
RSI IsSmallerThan: 35, 35, 25
RSI period: 4, 6, 4
SMA: 150, 175, 175, 150
Running the same test on the BTC-PERP market gives us quite different numbers however! Including a top ROI of just 223% compared to the insane 759% ROI we got from ETH. The winner of the BTC test also used a RSI IsBiggerThan: 15 value, which is quite different from the ETH test.
Now is this bot worth trying out in a live environment? I am torn, because 7 trades total in 2 months is still a very low sample size. Preferably I'd like to run a much longer timeframe test somehow. I'll have to figure out how to do that. But I guess for science I will throw the top 3 bots of ETH and BTC into a live environment and see how they do, once I try this out on a few more markets and coins.
So for today, we conclude with a new to-do list:
🚩 Another red flag in this case is the pure number of more than 750% ROI !? That is as far as I can tell an incredible high performance and very likely there must be underlying issue calculating this ROI. Remember the old saying about if its too good to be true then it usually is?
We will have to investigate more before we can continue safely.
I think there might be a 🐛 bug with Haas Labs here calculating the ROI. While is was putting this article together I had to put on my bug-hunter-hat 🎩 and continue down a rabbit hole. I sort of noted down what I did, so maybe the devs can take a look at it later and try and reproduce this. I'll probably have to clean this section up later. Well, living-document here we are.


In order to get a better idea about the validity of this test-result is making sure that on similar parameters these incredible values hold. One test we could attempt is using a spot market instead of the futures market and changing the exchange as well to make sure. Knowing that the other exchange may have lower fees, we have to adjust the the General Settings.
We will also conduct the following tests outside of Haas Labs, because there we have the option to select a longer timeframe and we now already know the specific settings we want to investigate further (the top 3 performing settings).
Going back into our Visual Editor, opening the Backtest Remote we first make sure we have the hard-coded values correct (12hours expressed in seconds & 5 days end trigger for the order). Then we adjust our Script Settings to the best performing result from Haas Labs and run confirmation tests.
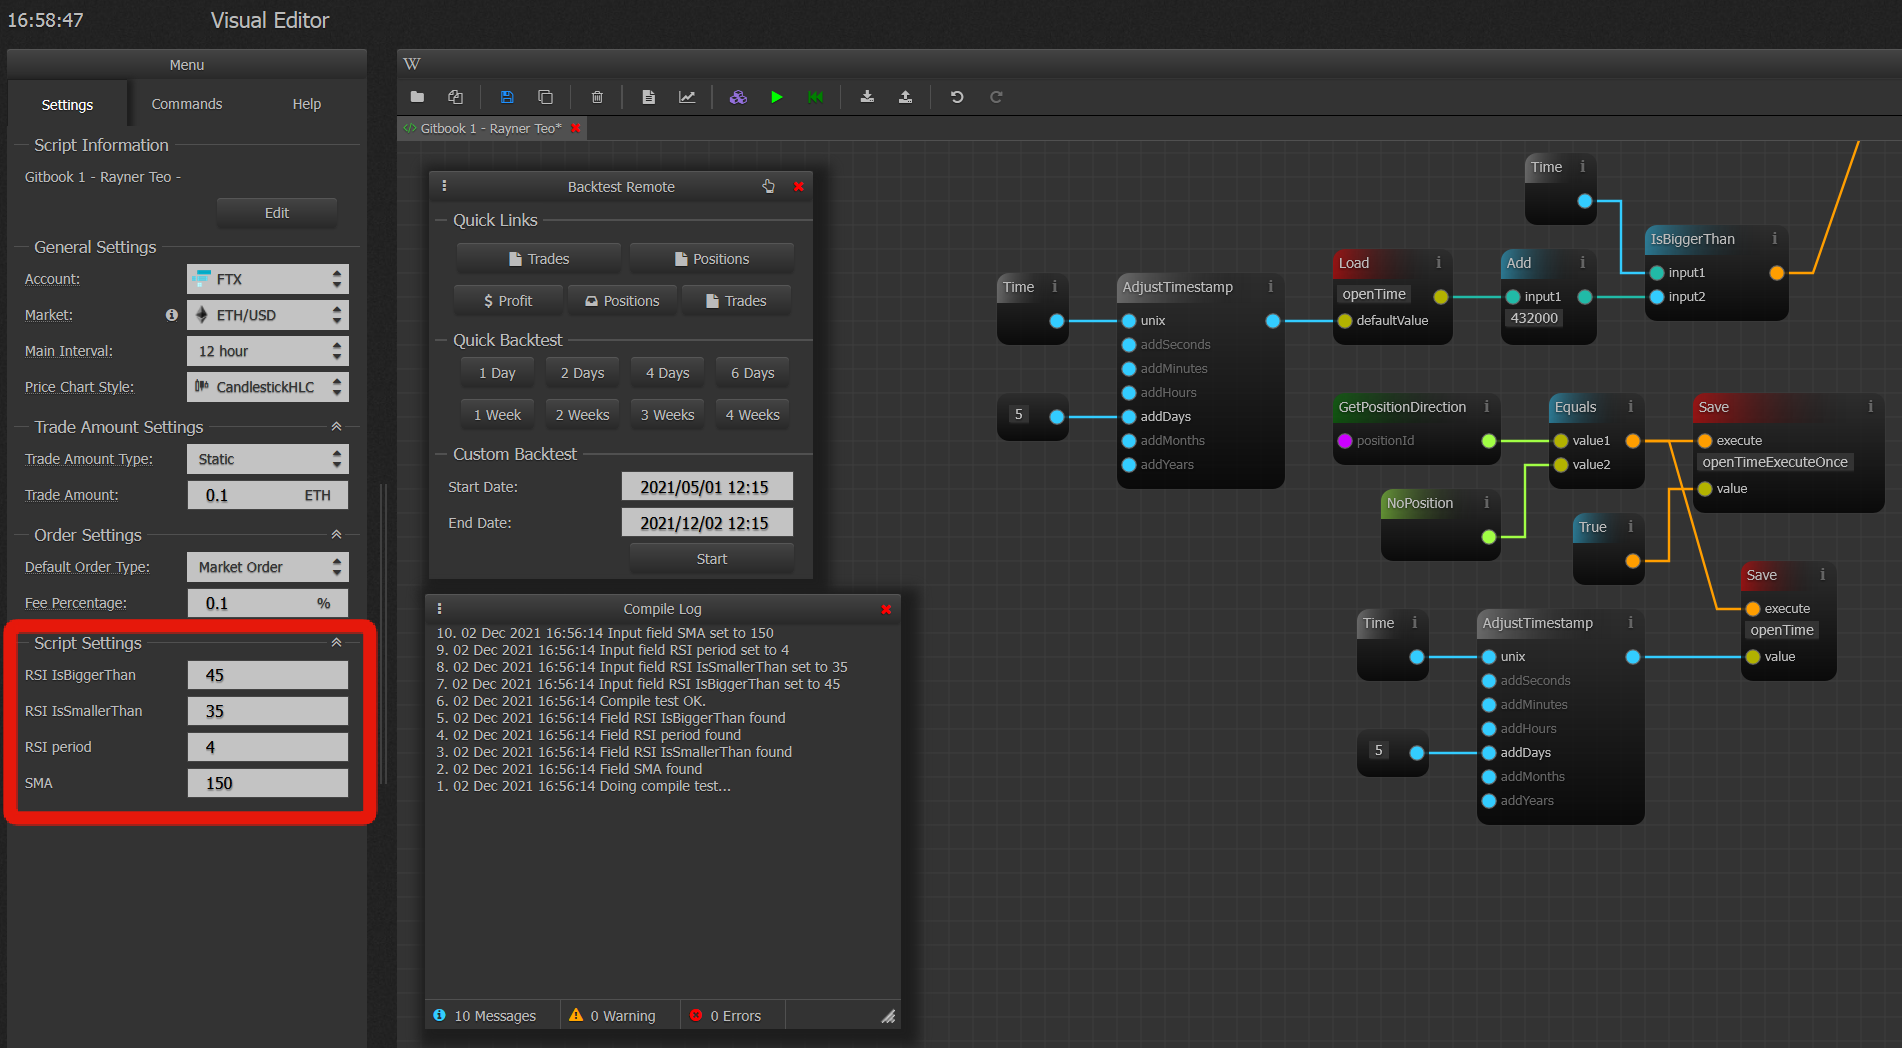
🚩 Our first backtest, running the same script on a spot-market yields very different results!
Positive, but very different. This confirms our suspicion that we might need to reduce our testing to spot-markets for now as this result seems more realistic in the first place. We outperformed Buy & Hold however, wich is already a win.
10x total trades is also different than we reached with our futures test. Does re-taking the tests a few days later really yield that big of a difference in signals? (Dec 2nd vs Nov 29th). It's possible that we had 3(!?) signals on the 3 days not back-tested anymore, but something is off. I can smell it -.- ..
Anyway, below is the profit report for our spot-test of the same script but instead for Kraken ETH-PERP now on FTX ETH-USD, but with the same settings (45/35/4/150).


While digging further I found that Haasonline had in the meantime released a patch and I upgraded from 3.3.39 to 3.3.41 BETA, which supposedly improved Kraken Futures order parsing. (oh oh)
So I ran the same Haas Labs test again to see what the results would say this time and well, let's say we randomly wrote a whole article draft, found a bug that got fixed and now have lower ROI that we did before.
Good or bad? 🤔
Well, with this little unplanned detour we can look at the Haas Labs backtesting results again which we probably should have gotten in the first place. And these look bad. We only had 2 out of 100 testers yield a positive ROI. And on top of that the amount of trades was very low for a 4 week timeframe.


... wait a second. We picked a 12 minute interval, not a 12 hour interval.
HAMSTERPOOP. 🐹
Alright lets do this AGAIN. jeez.
... actually. Same result. 🤓 What?
How can the PERP market be so much better than the SPOT market. It can't.

To the Discord we go once again ppl. Is a 4 RSI that short of a timeframe trigger, that it makes that much of a difference?

Btw, i'm assuming that because it is leverage that whole ROI just gets multiplied by 20x or something. Yeah lol actually - 50x it is. 734/50 = 14,68, thats close enough.

update edit: my guess was sort of correct, thanks to Franco and pshai from the official discord for helping out!
🚩 not the ideal way to display it, but at least we know that Haas Labs per definition asssumes max leverage. yikes


Strangely enough the best performing RSI and SMA values are slightly different too on spot?
Weird. I ran these two tests literally 10 minutes apart. Maybe not finishing them completely and due to the "intelligent" settings they are slightly off? Or Spot vs Futures really is a difference.

Long-story short: we now know how to test things with Haas Labs and we have a baseline we can work with. Because of the insane ROI and the assumption that probably nobody should run 50x leverage, I will continue any further testing on SPOT markets, so we get results that aren't multiplied by leverage. lol
more soon
If you find the information provided here useful, please consider signing up for the HaasOnline Bot or the FTX Exchange via my referral link. 🤗
You can also directly send me a donation (₿) bc1q7vl36e44e06zmedqrxdzauqea9k7rgcfmylsq4
Last updated